kufreu.github.io
repository for geography work and other things completed by kufre u.
comparing aster & srtm data for andes mountains
Here I looked at the reference data for the study area using NUM (number of scenes) files for ASTER and SRTM data and compared the outputs of the hydrology analysis using ASTER and SRTM data. Possible sources for error and uncertainty in the original datasets and if/how these things propagate through the analysis were also examined.
visualizations of .num files
aster
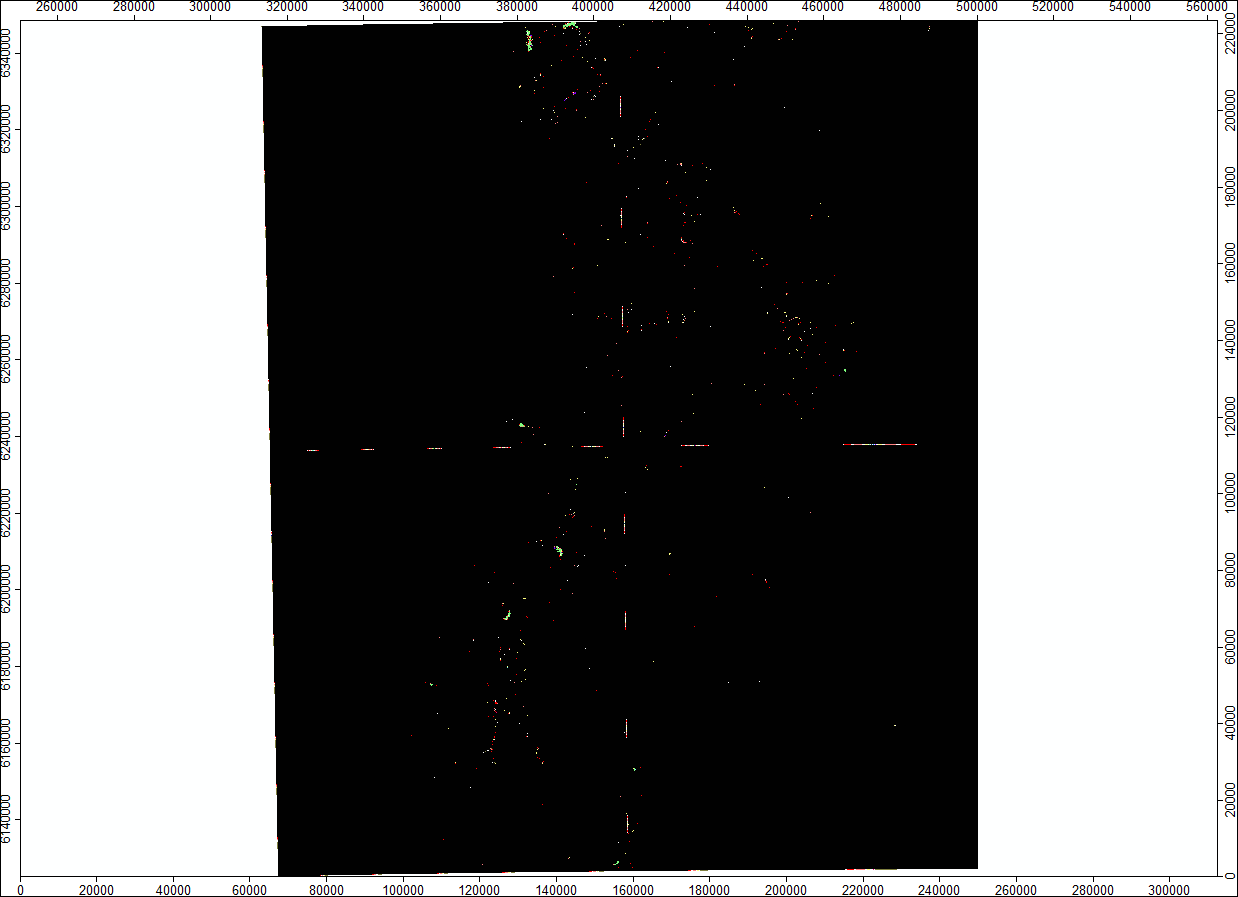
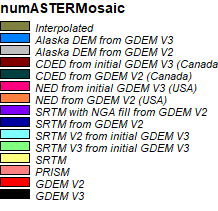
The reference data for ASTER much of the data for this region came solely from the ASTER GDEM V3, which is the third version of the ASTER global digital elevation model. There are areas dispersed across the region which were either interpolated or came from SRTM. The individual tiles can still be seen after being mosaicked because data along the tile borders were obtained from the USGS National Elevation Dataset (NED), SRTM, and other sources.
srtm
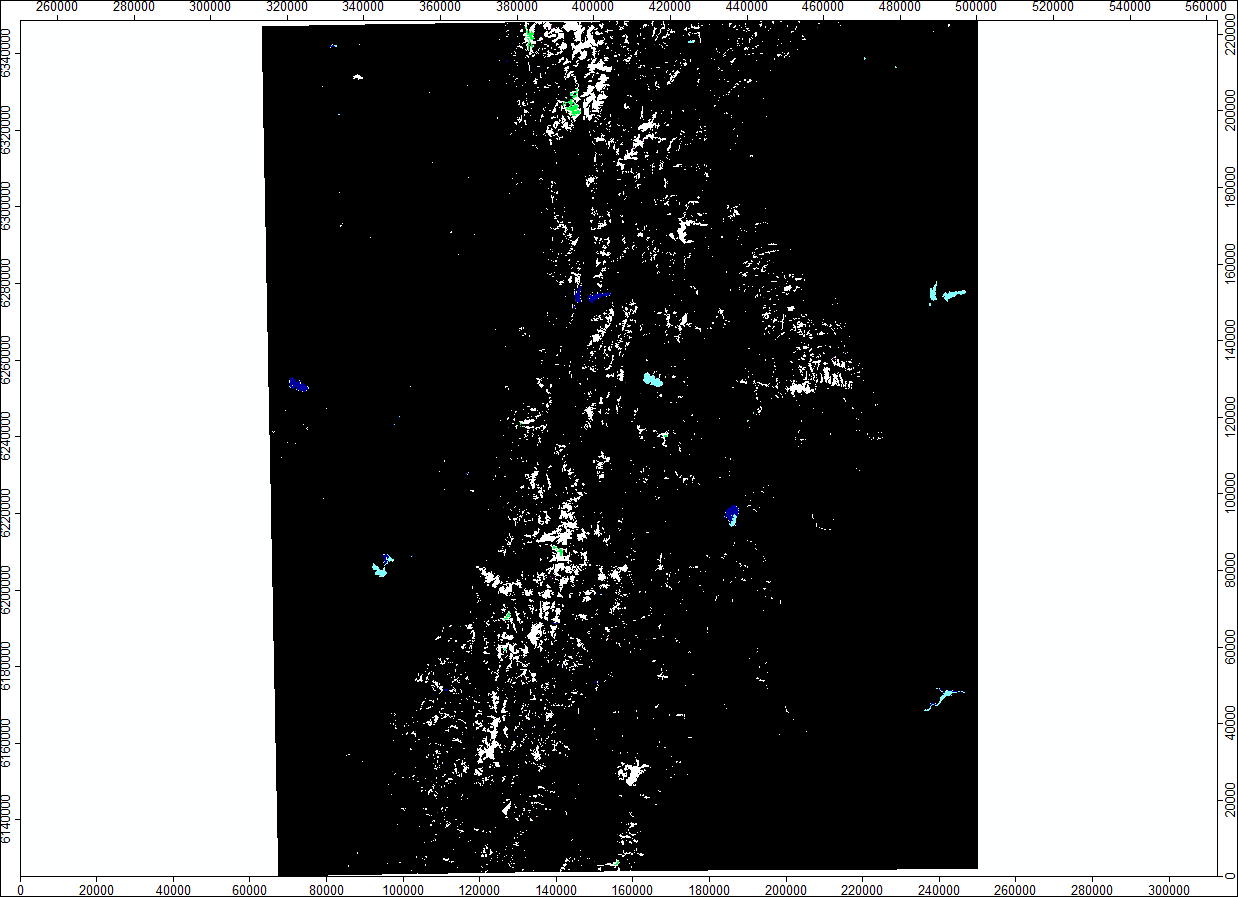
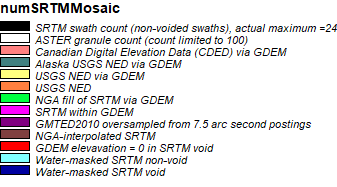
A considerable amount of data in the Andes came ASTER, much more than data ASTER used from SRTM. The data for the valleys were obtained from the shuttle mission.
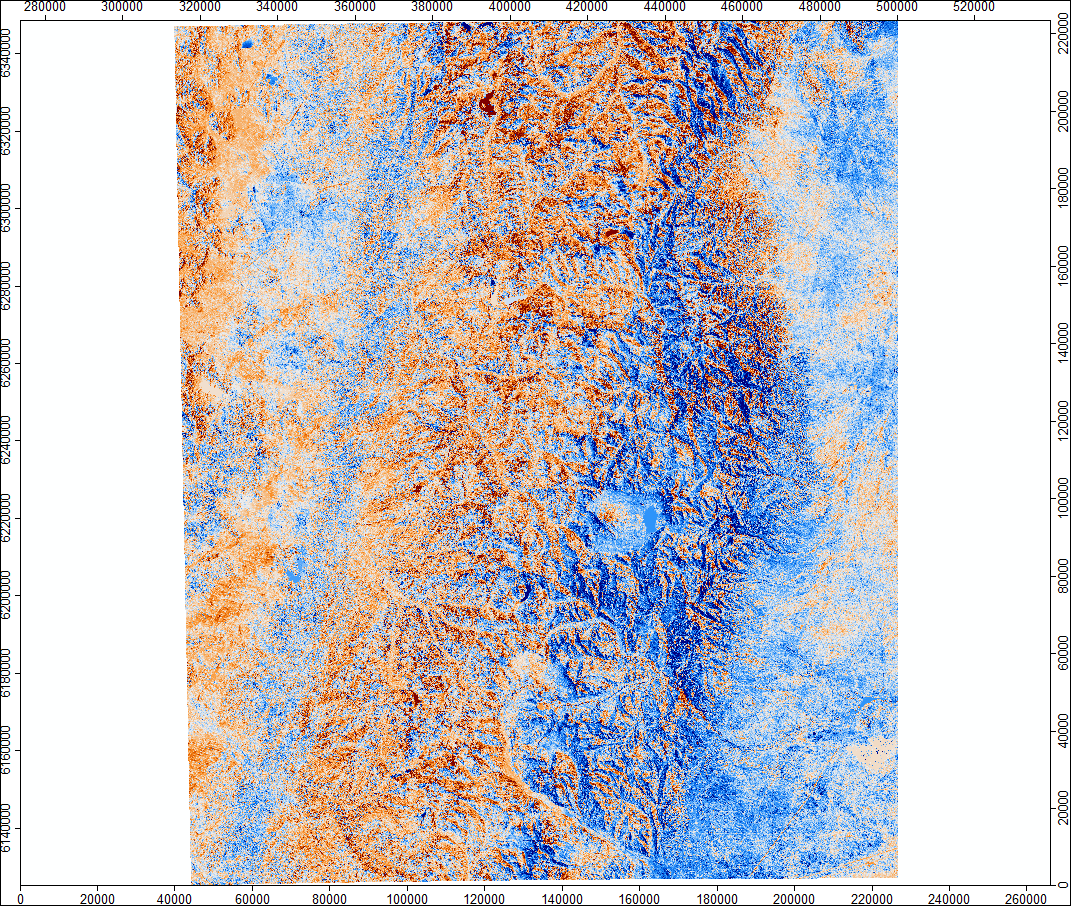
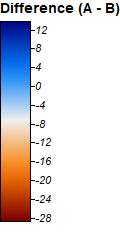
difference between aster and srtm elevation data using grid diffrence tool in saga
channel network difference
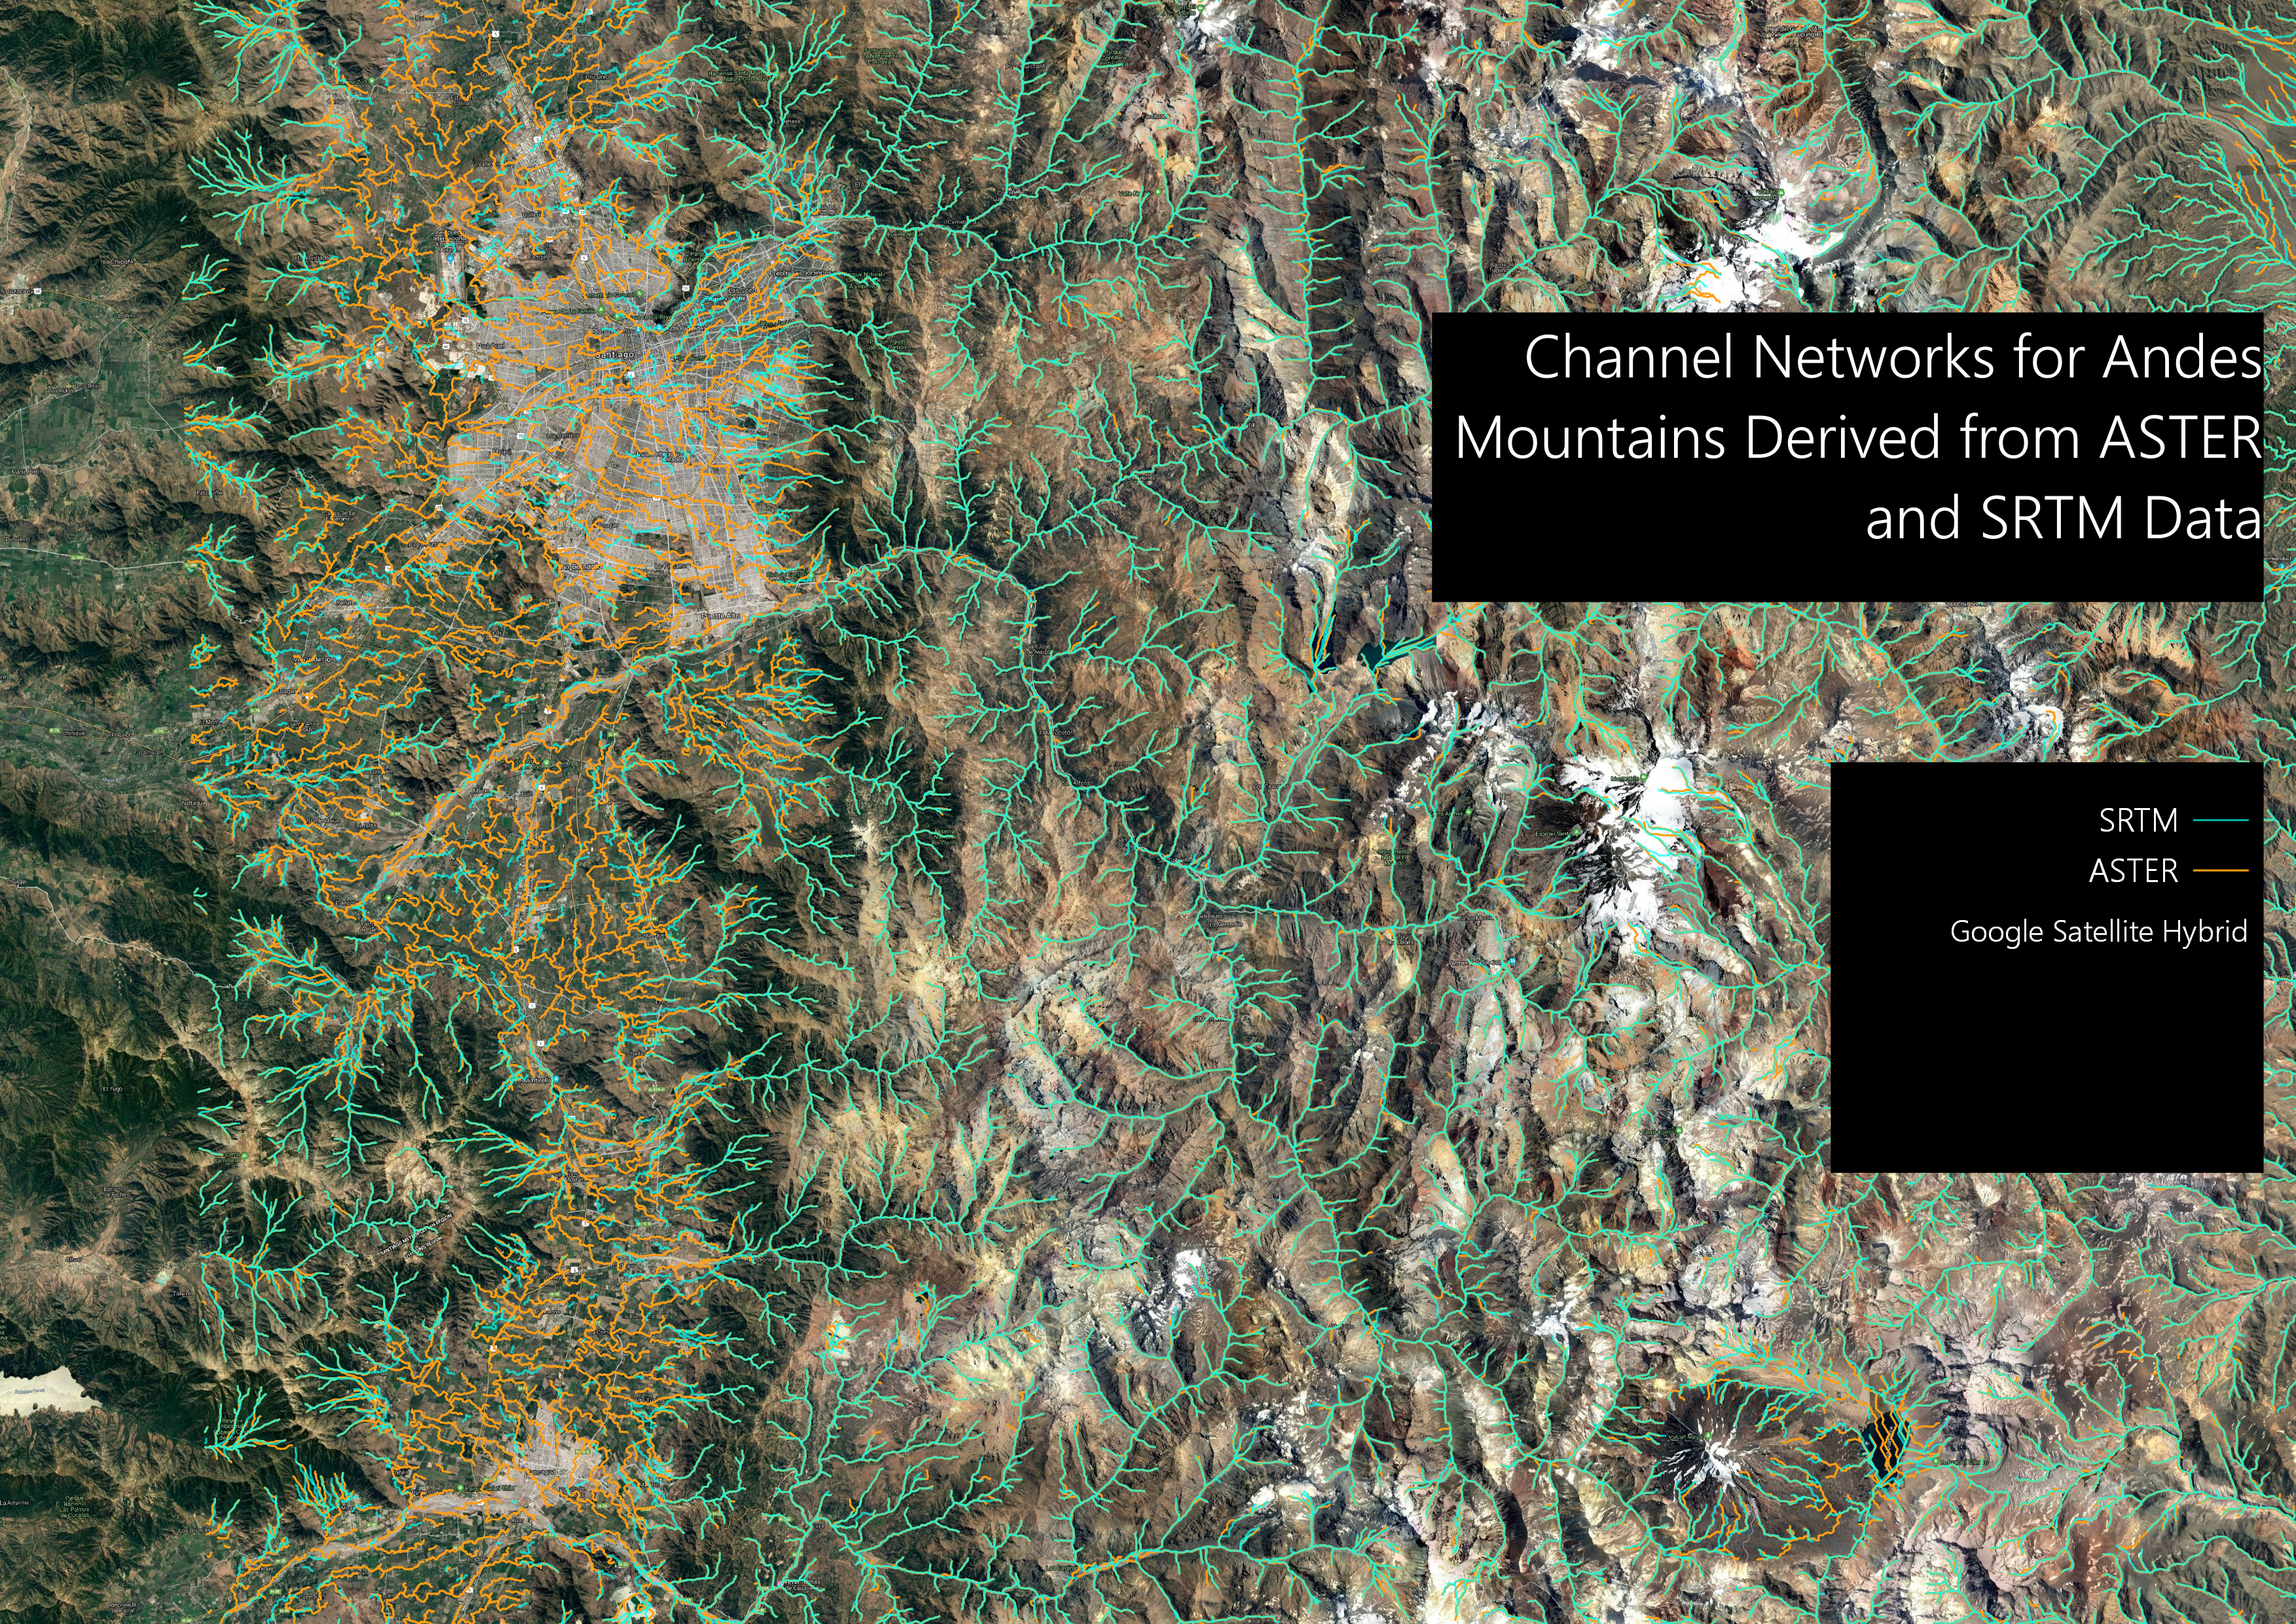 The channel networks derived from ASTER and SRTM data are somewhat identical in the mountains, with the SRTM channel network almost completely masking the ASTER network. The channel networks begin to differ in the valleys on either side of the range. In these areas, the orange of the ASTER layer is visible as the SRTM channel network becomes disjointed. Santiago, a place of such discontinuity, can be seen in the top left of this image. This is expected after viewing the .num files for SRTM.
data sources
NASA/METI/AIST/Japan Spacesystems, and U.S./Japan ASTER Science Team. ASTER Global Digital Elevation Model V003. 2019, distributed by NASA EOSDIS Land Processes DAAC, https://doi.org/10.5067/ASTER/ASTGTM.0030
NASA JPL. NASA Shuttle Radar Topography Mission Global 1 arc second. 2013, distributed by NASA EOSDIS Land Processes DAAC, https://doi.org/10.5067/MEaSUREs/SRTM/SRTMGL1.003
files
qgis project file and shapefiles for channel networks